
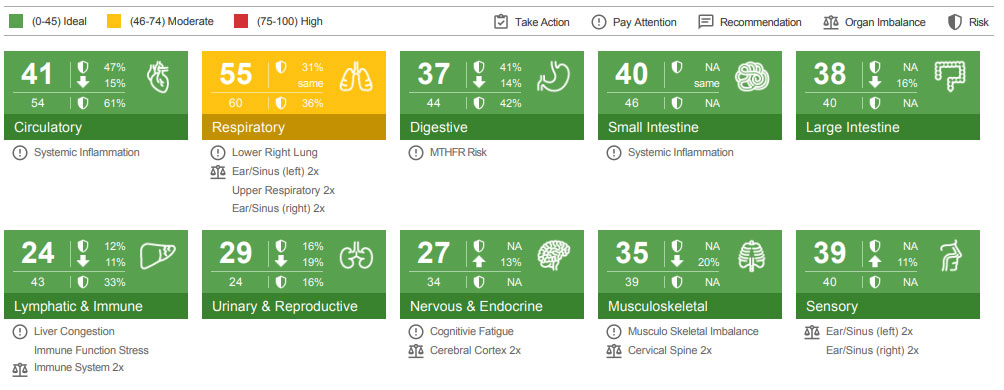
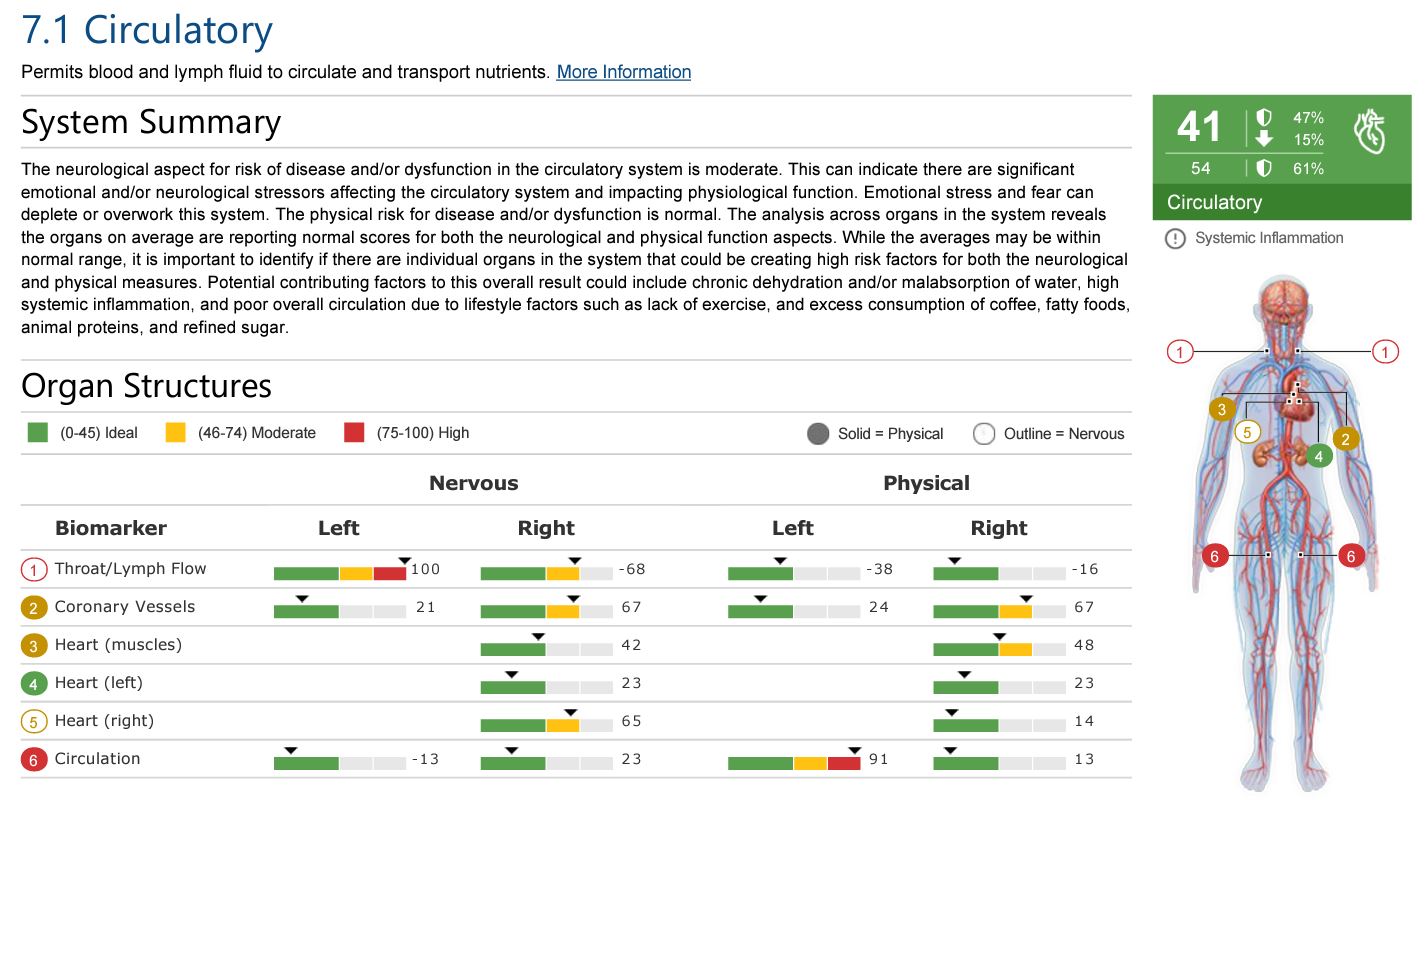
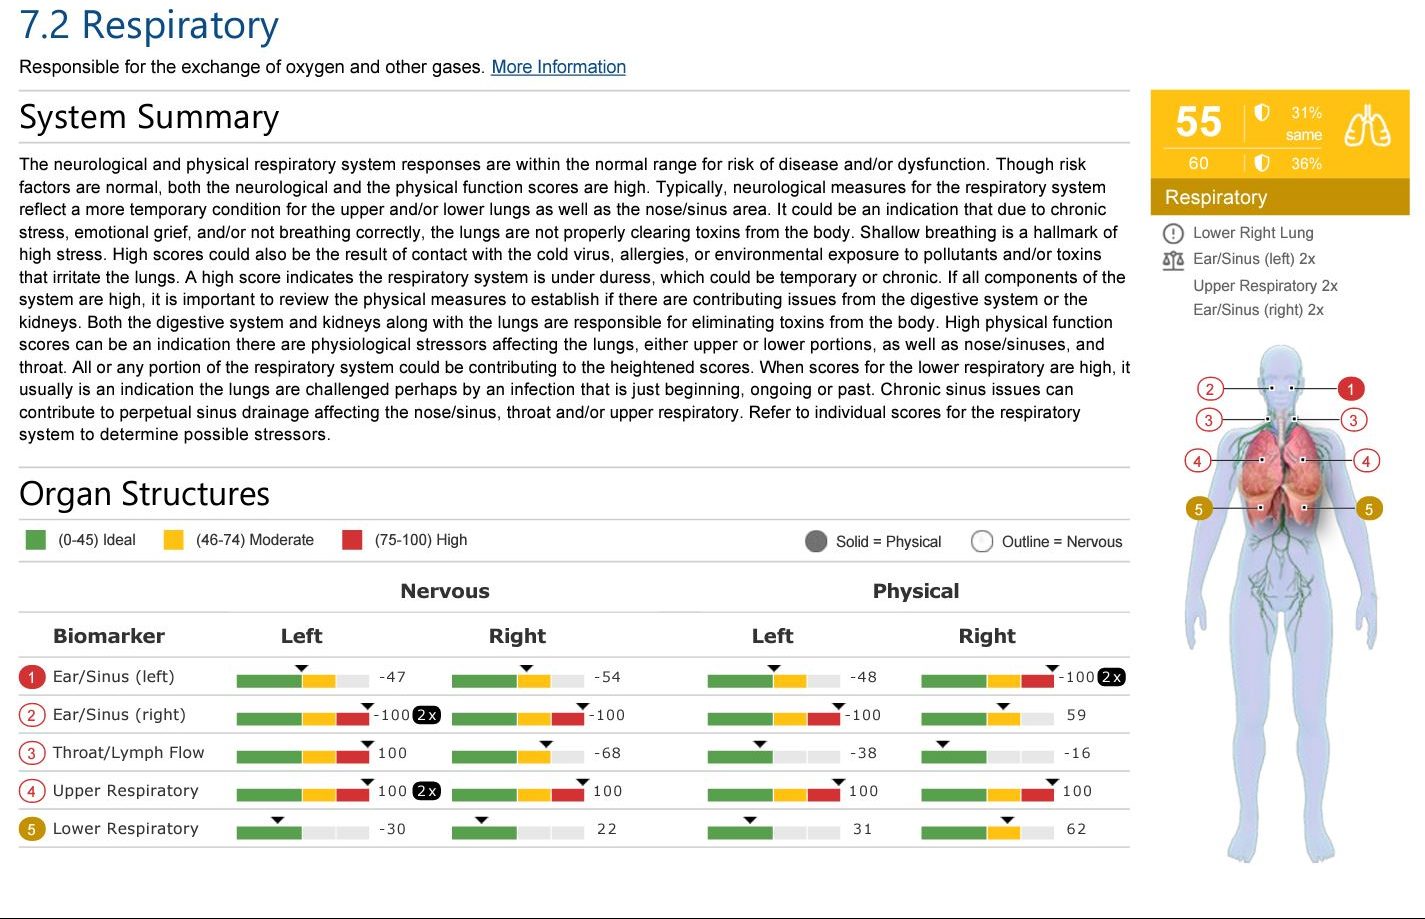
The dashboard below provides a quick overview of the body’s 10 major systems. On a scale of 0 – 100, the score for each system’s status is displayed: Ideal (green) scores 0- 45, Moderate (yellow) scores between 46 – 74, and High (red) scores 75-100. Additionally, there are icons to alert you to individual organ imbalances that are substantially elevated; icons notifying you about energetic changes that could indicate a disease pattern that requires attention now, and those that are less emergent, that you should keep an eye on. The large number is the score for the physical system, while the smaller text is the nervous score.
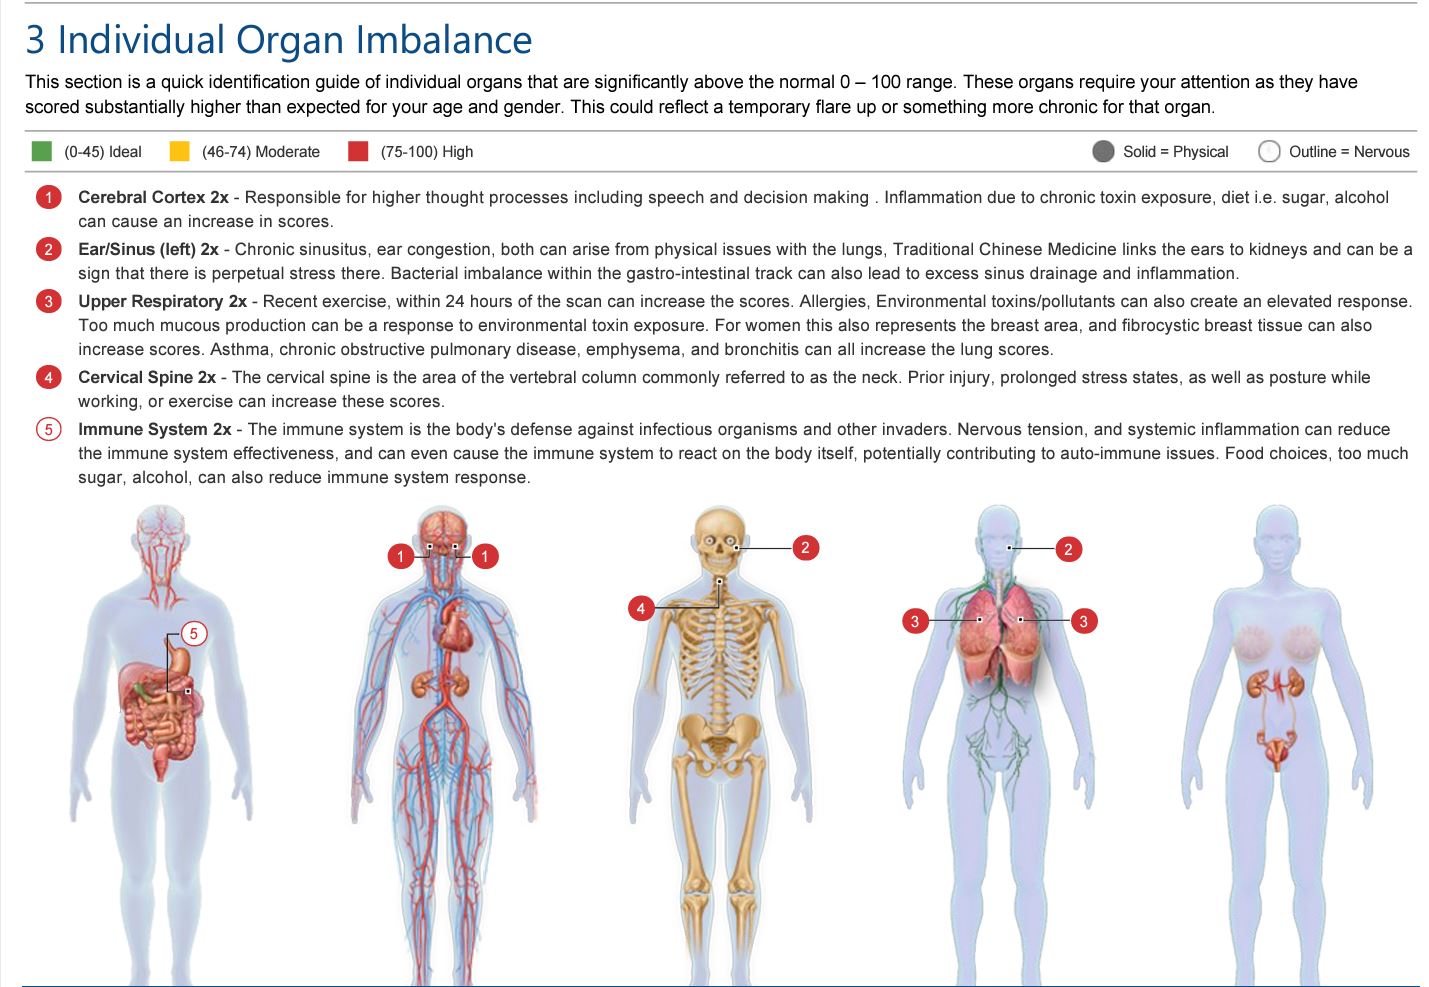
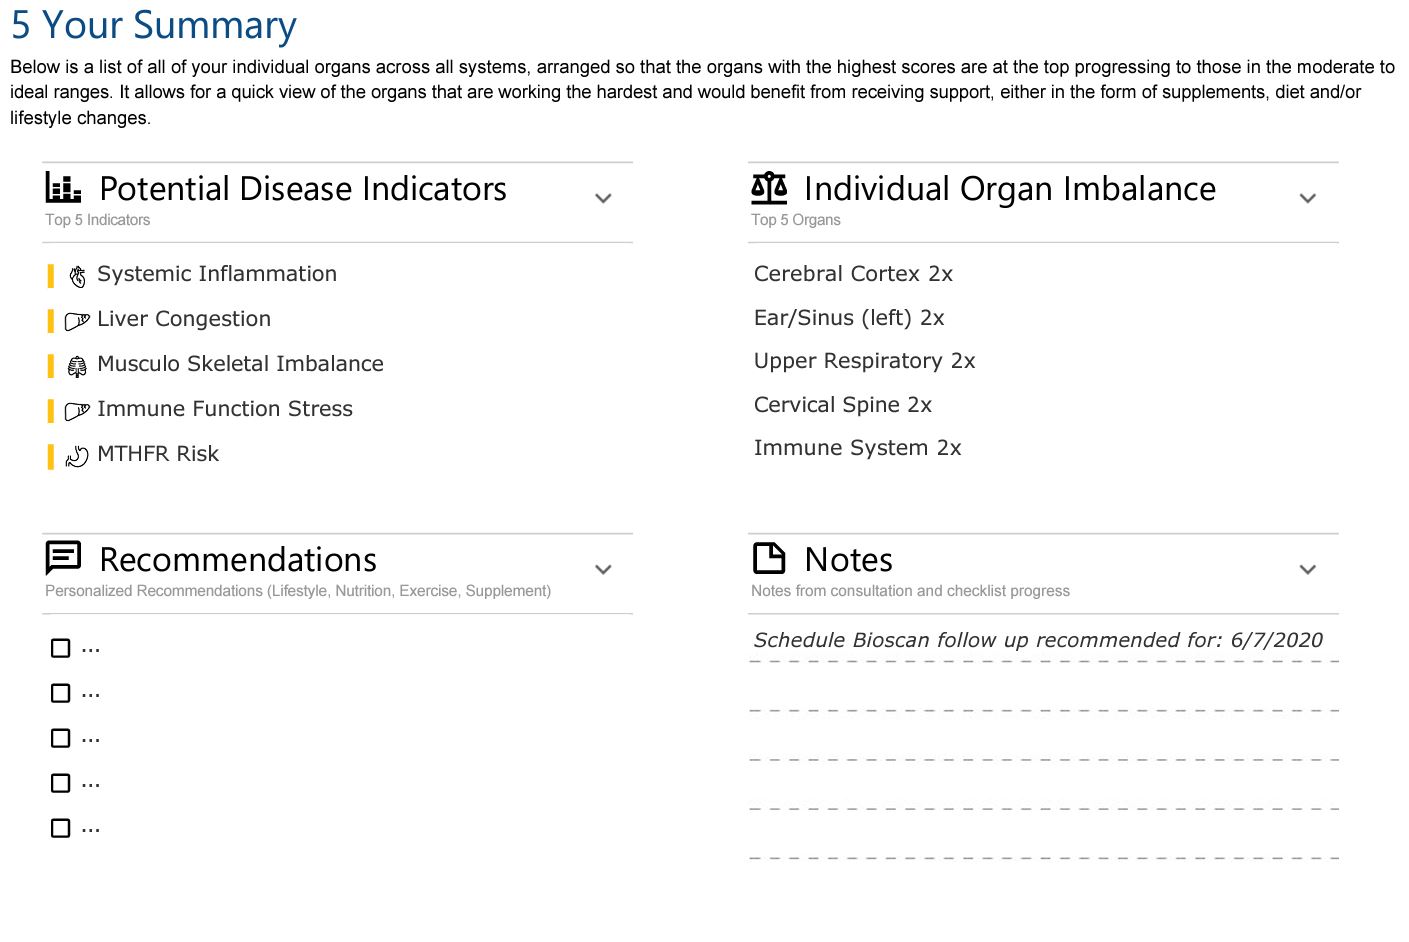
The individual organ imbalance section reports on the top 5 organs (systems) that are scoring above 100. The number in front of the x is an indication of the multiple of 100 that the organ/system is reporting. So in example if the number is 2x, this means that the organ/system is scoring in the range of 200’s. The range of expected scores are from 0 – 100, so when an organ reports above this scale it is important to look into why this is happening and look to explore methods/means to bring the score back into the normal range of 0-45.
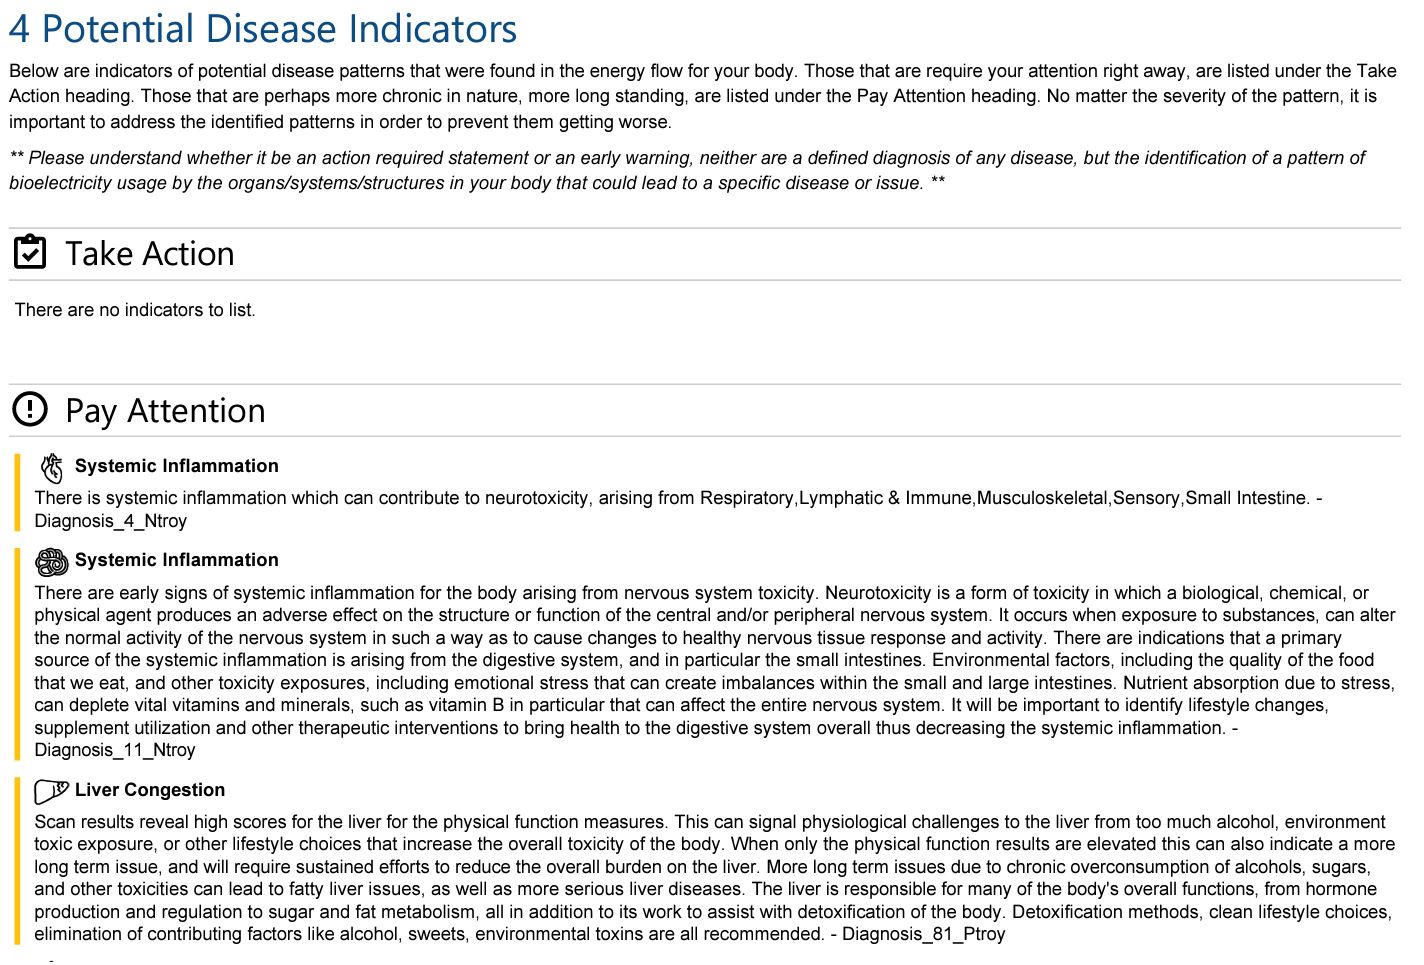
The potential disease indicators section is based on energetic patterns found within the results that could be indicative of the presence of a potential pattern of dis-ease. The potential disease indicators are listed in order of importance with those that require immediate attention at the top. From there the list goes to those indicators that you would benefit from taking notice of and perhaps beginning some preventative measures to address the imbalances found. These indicators might be producing symptoms that you are already aware of or there may be several that you are not aware of yet. These do not represent diagnoses of any kind but are representative of energetic patterns that could be indicative of a disruption within the emotional and physical bodies.
The summary section is a grouped page that provides the top five potential disease indicators, the top 5 organ imbalances, as well as a section for recommendations to be filled in as well as a section for notes. There’s also a reminder for when you should visit for your next scan to assess progress and optimize your path forward.
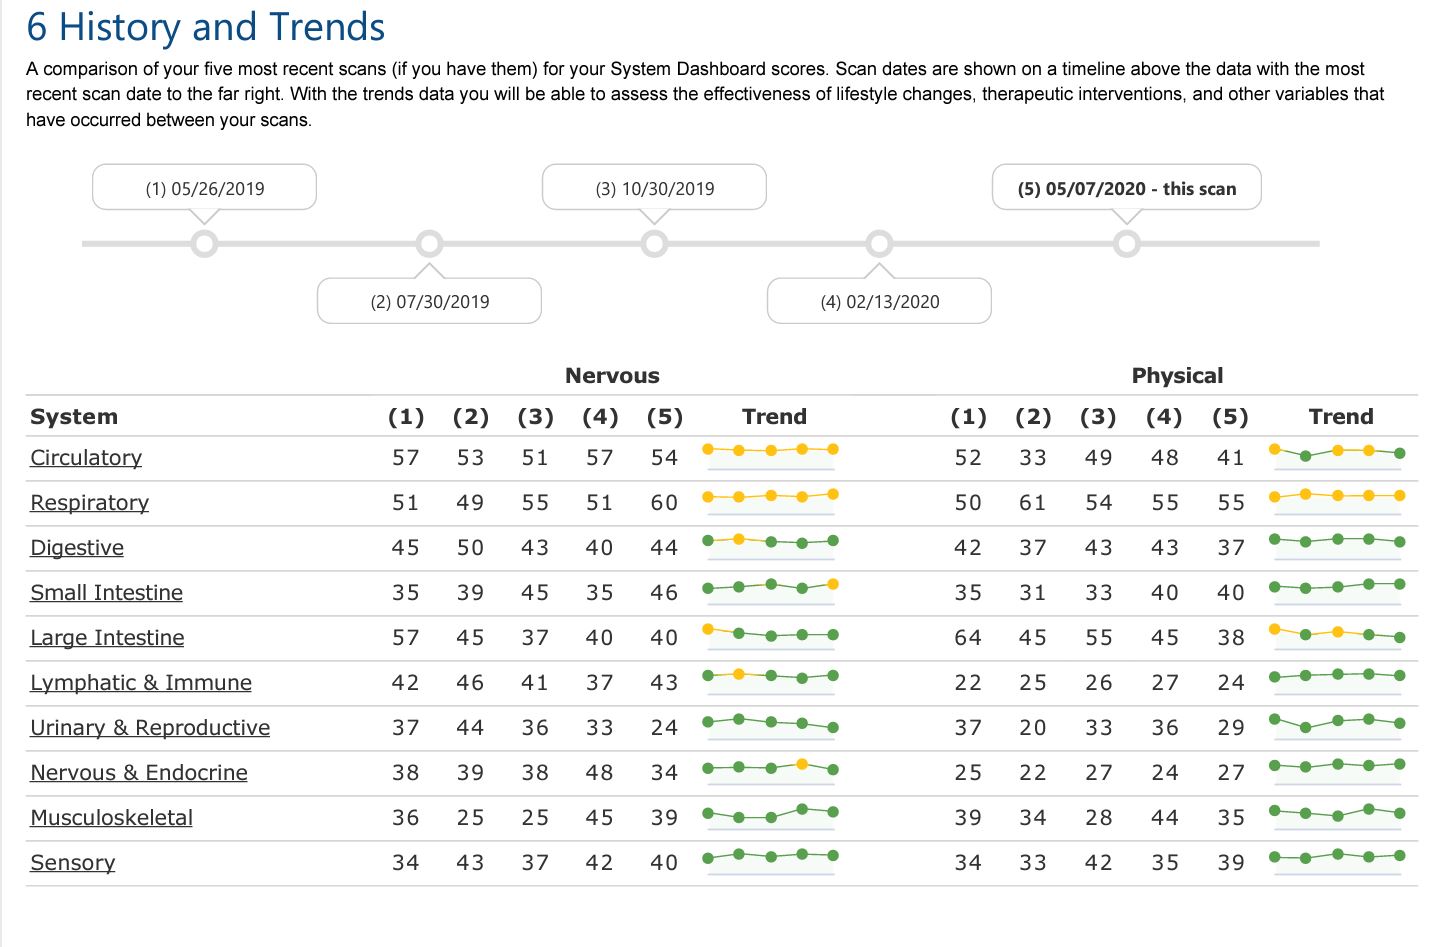
The history and trends section provides a comparative look at the 5 most recent scans that you have done. It compares the overall score for both physical and nervous systems. With this quick visual depiction you can see the progress or changes you have made through lifestyle, nutrition, and therapeutic interventions.
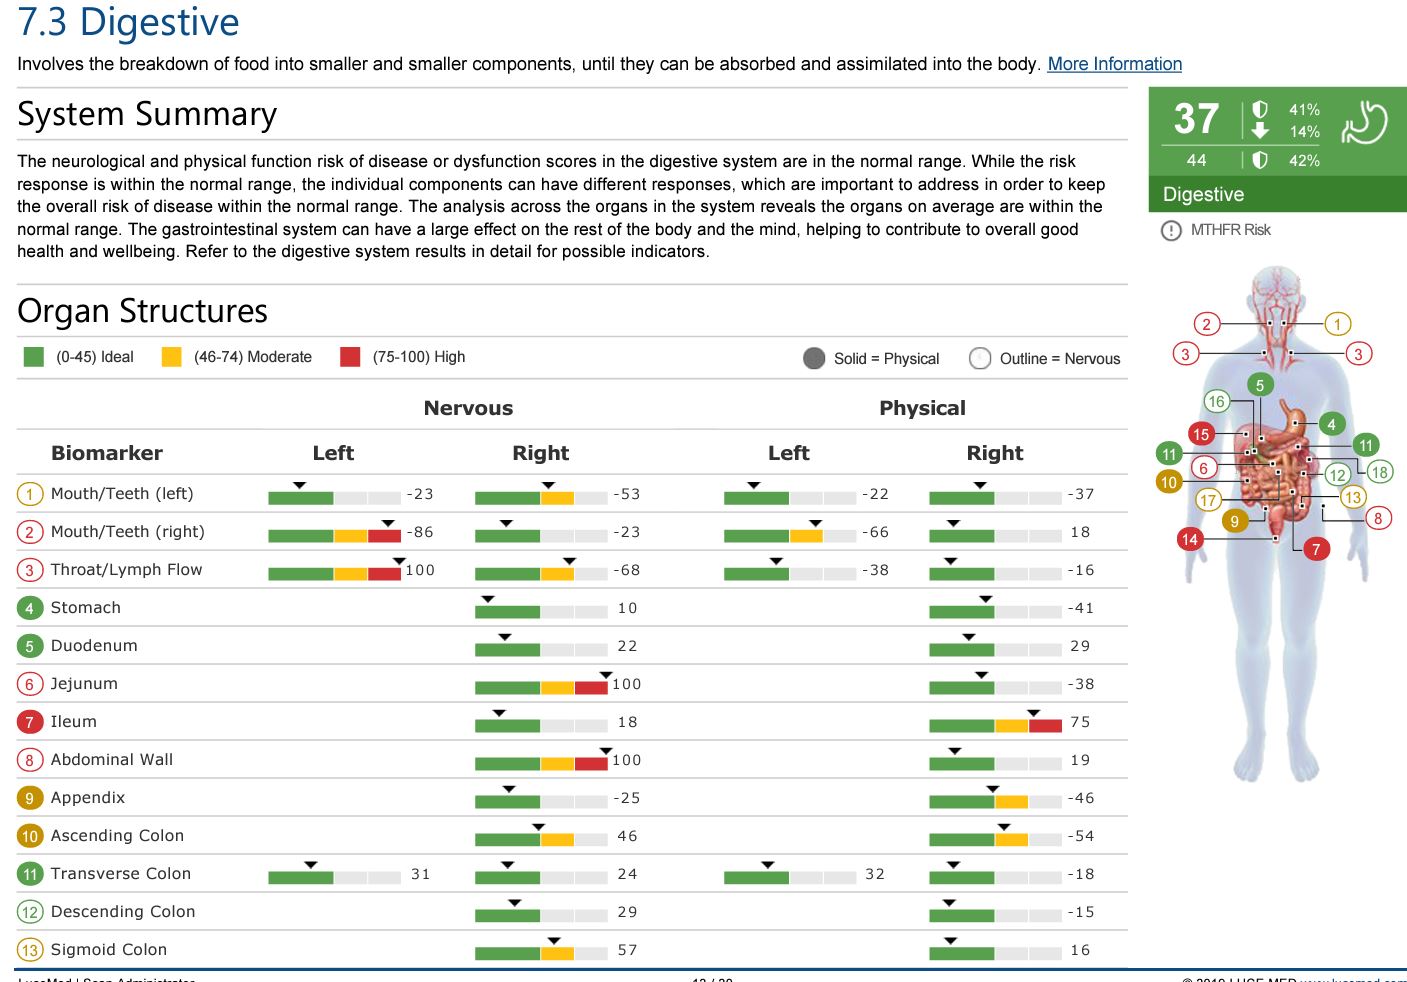
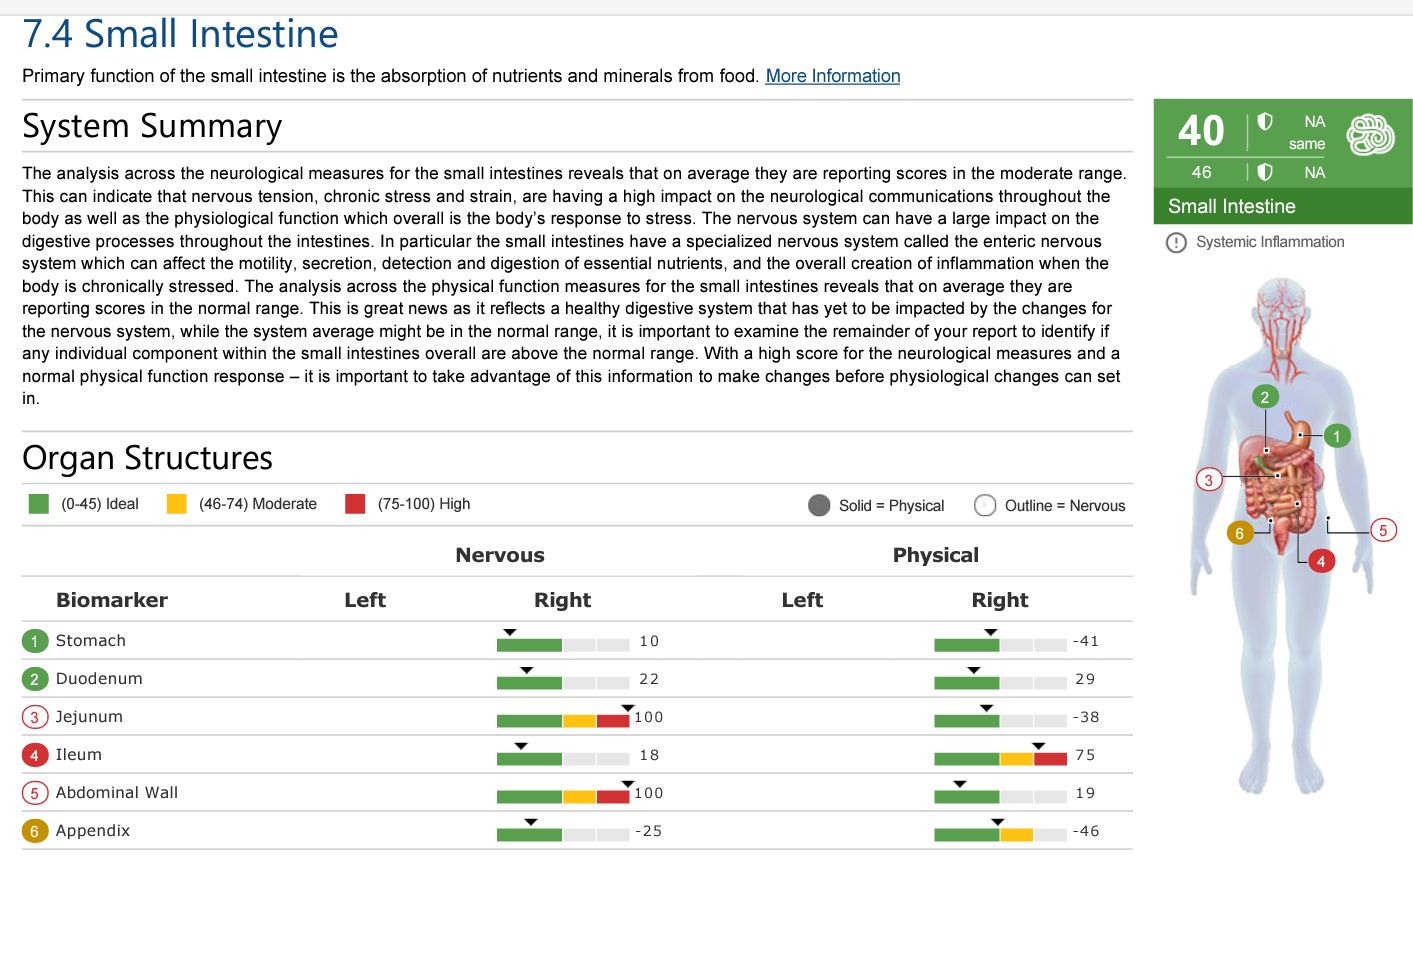
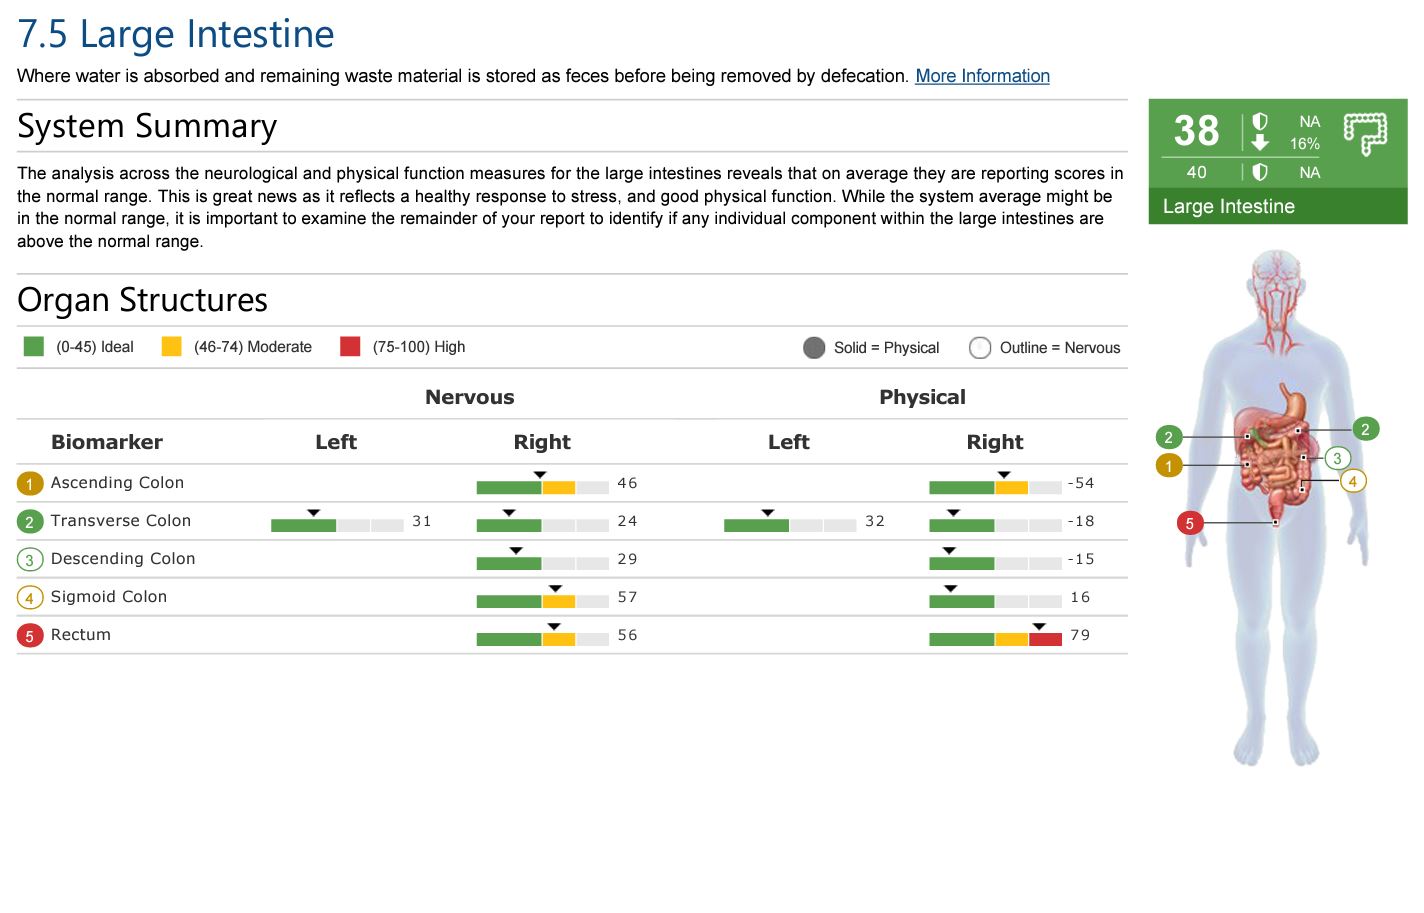
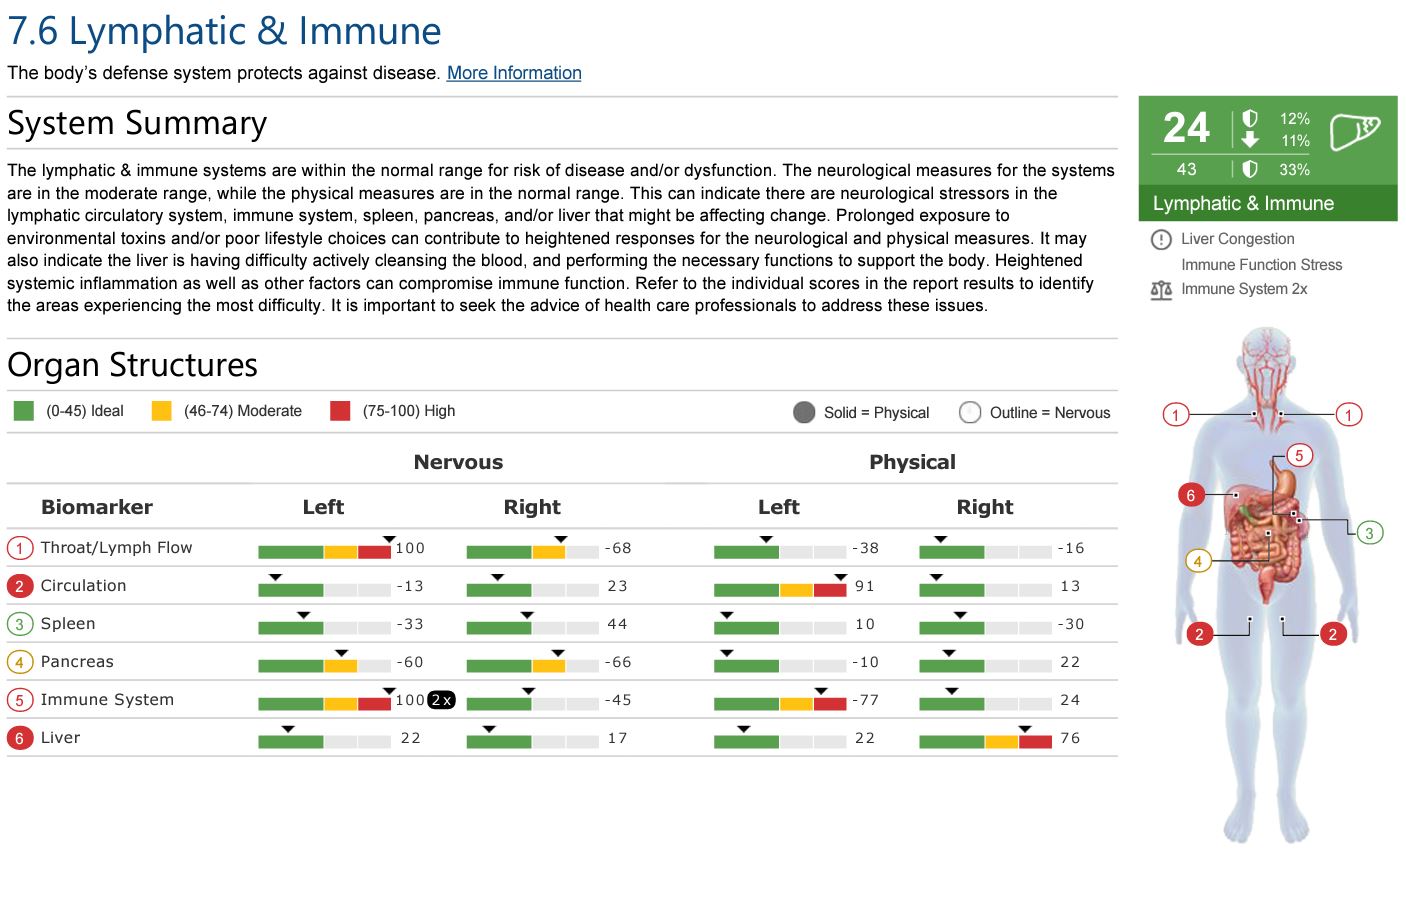
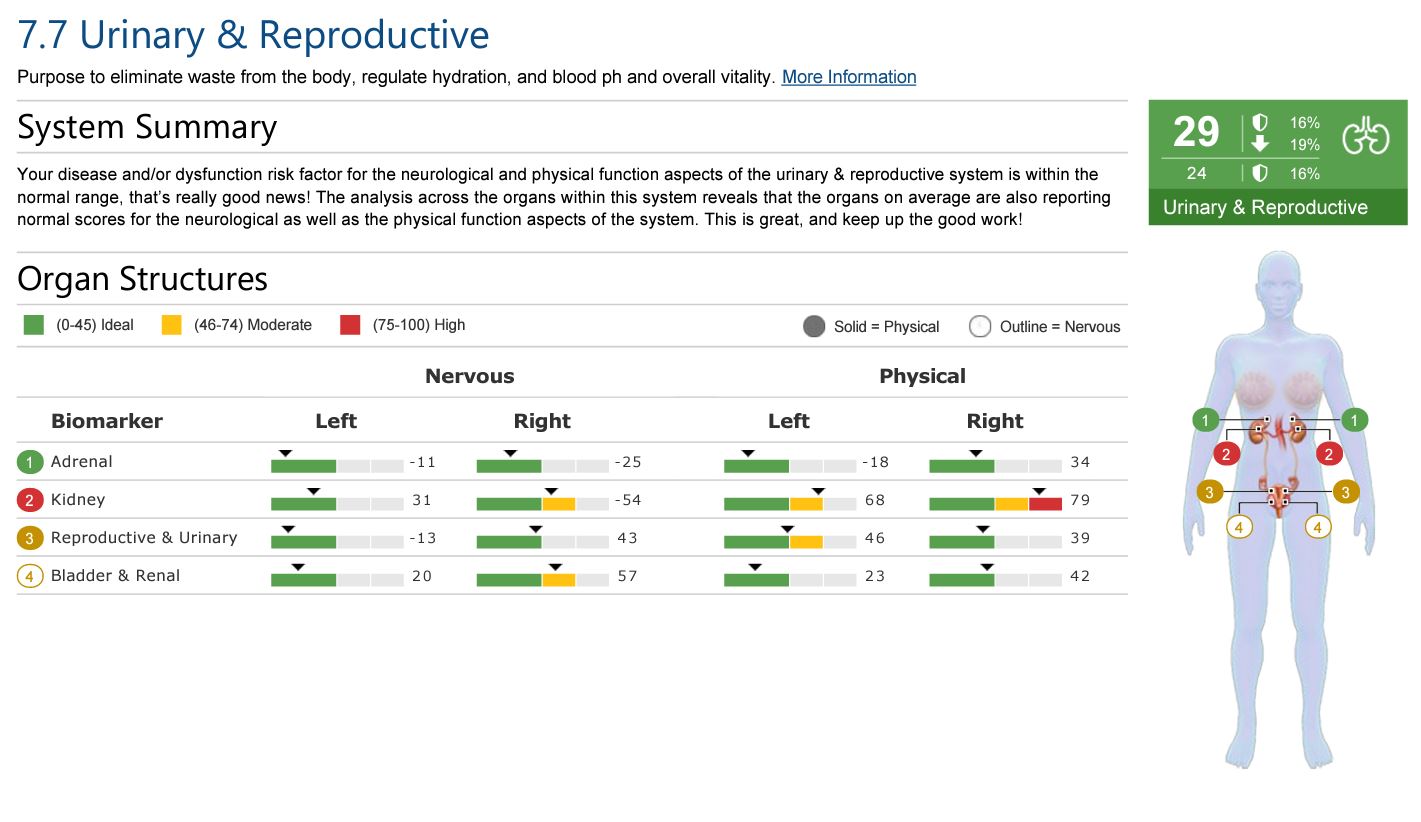
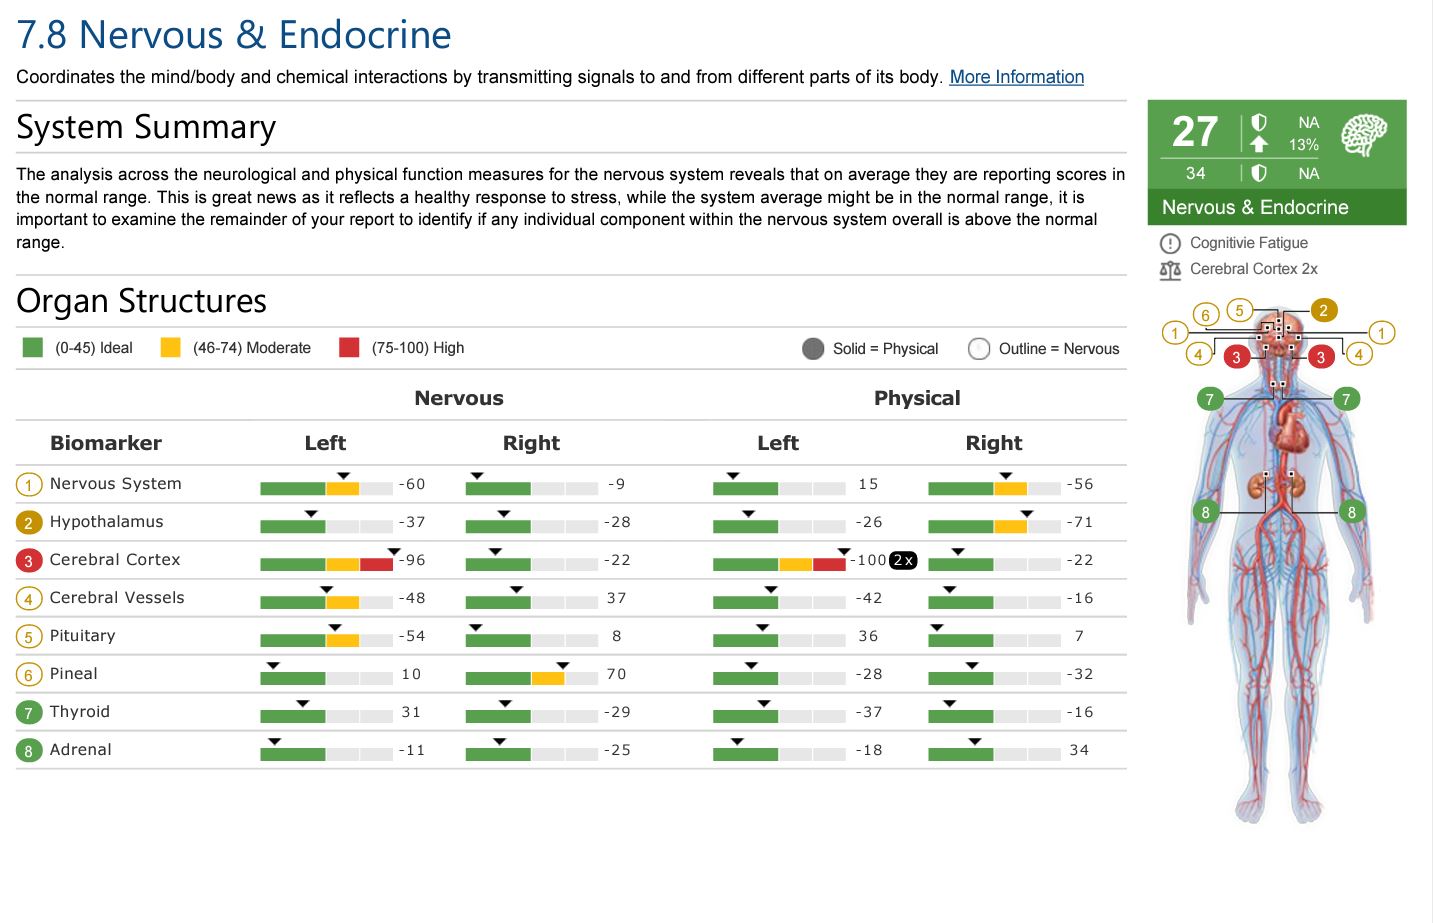
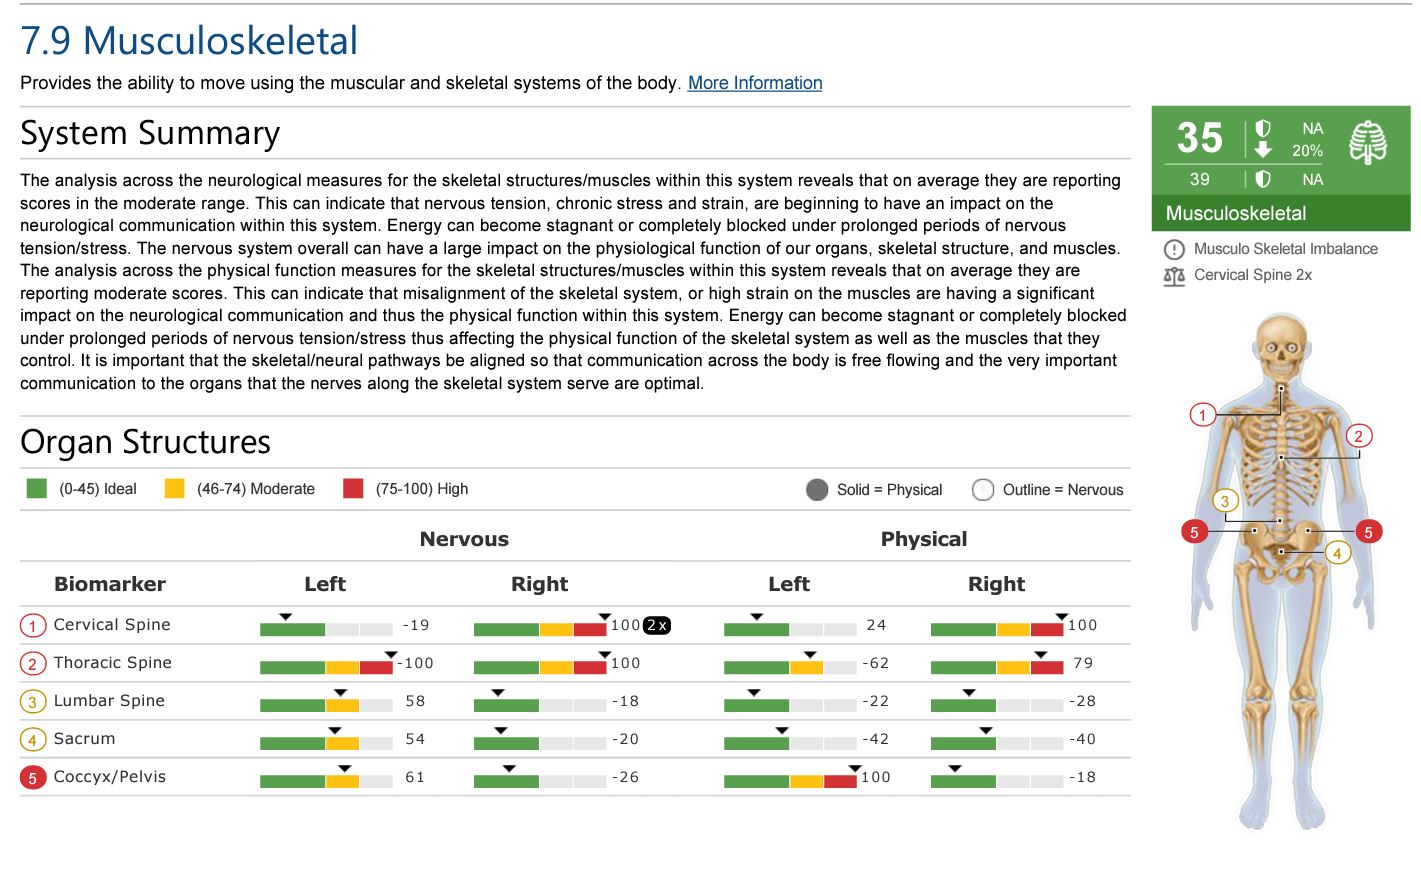
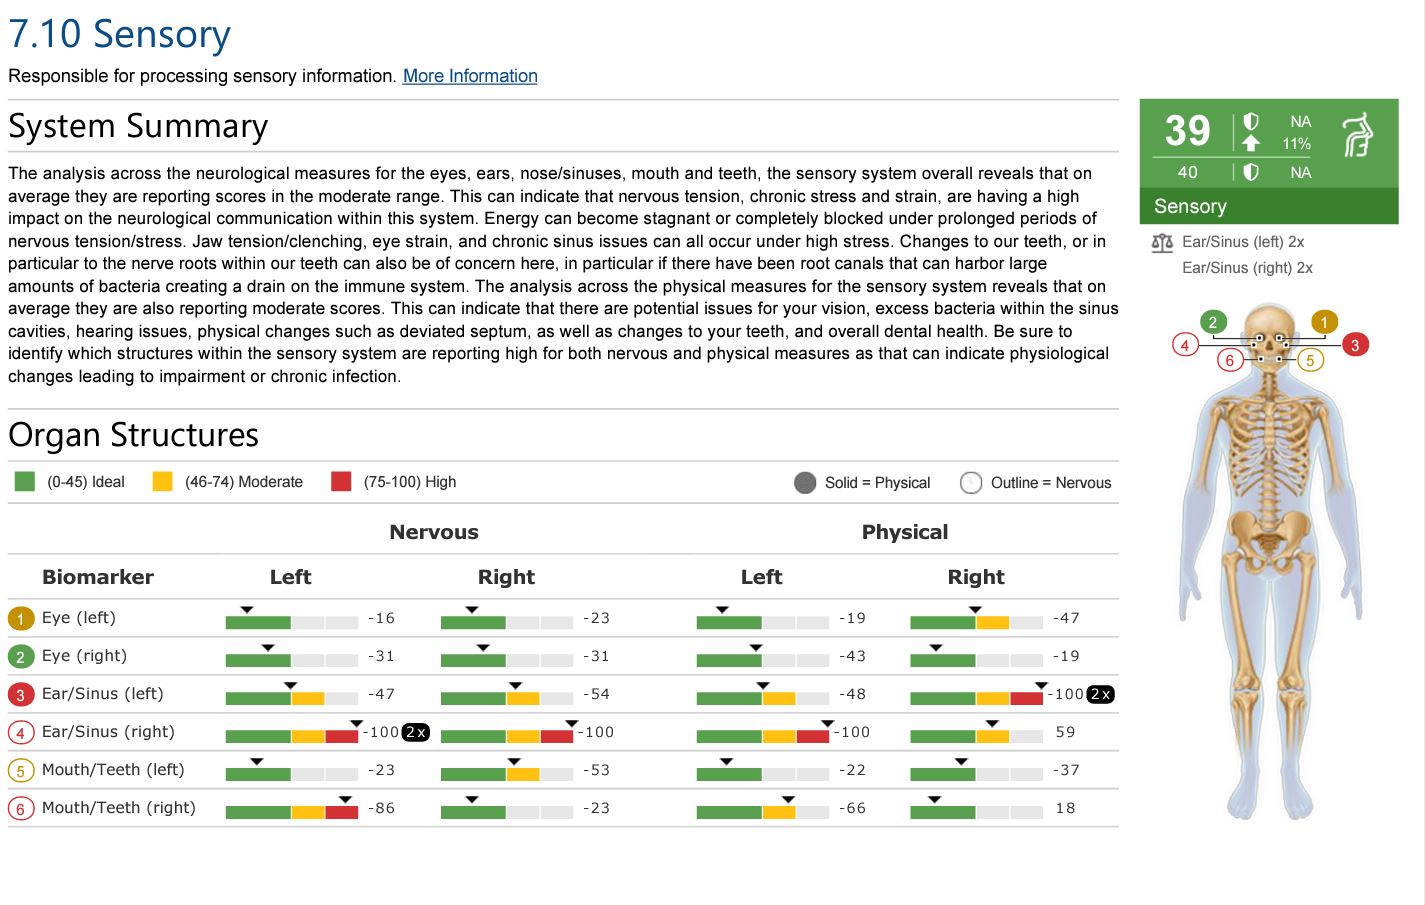
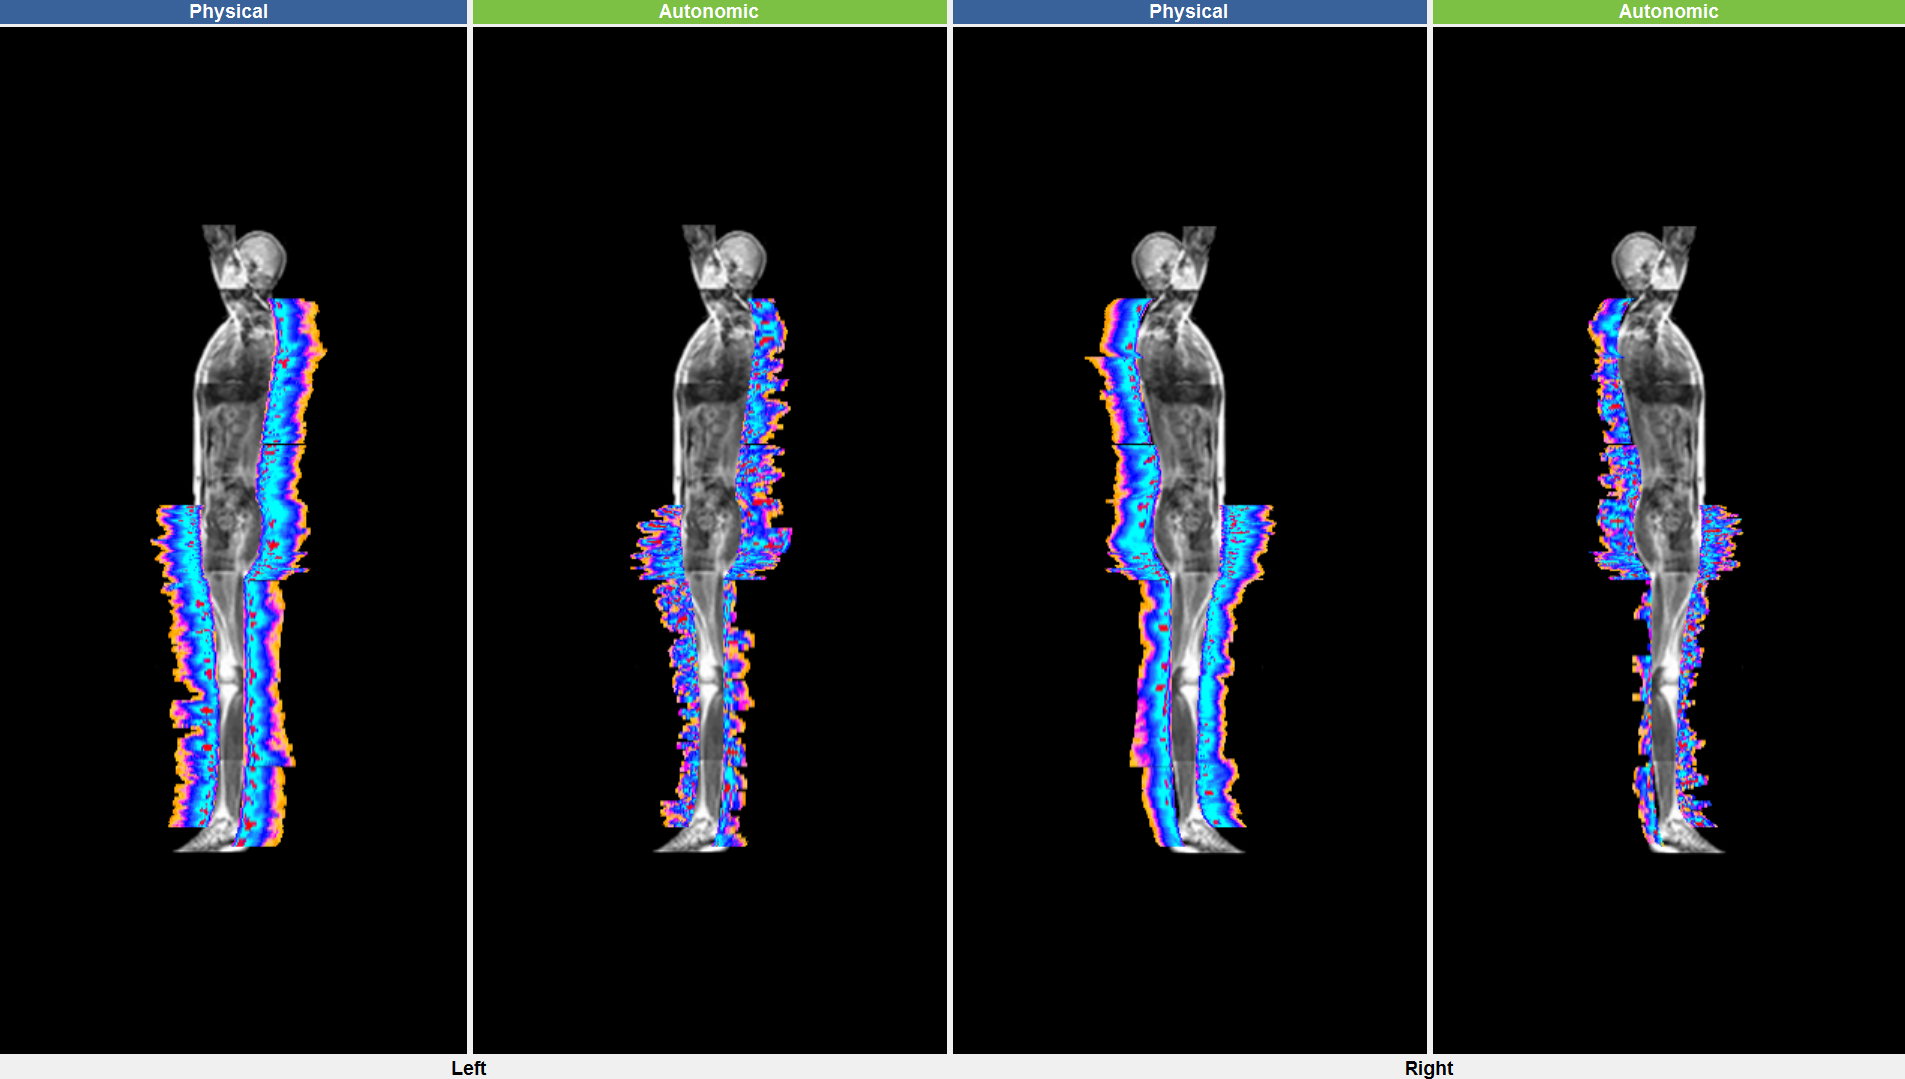
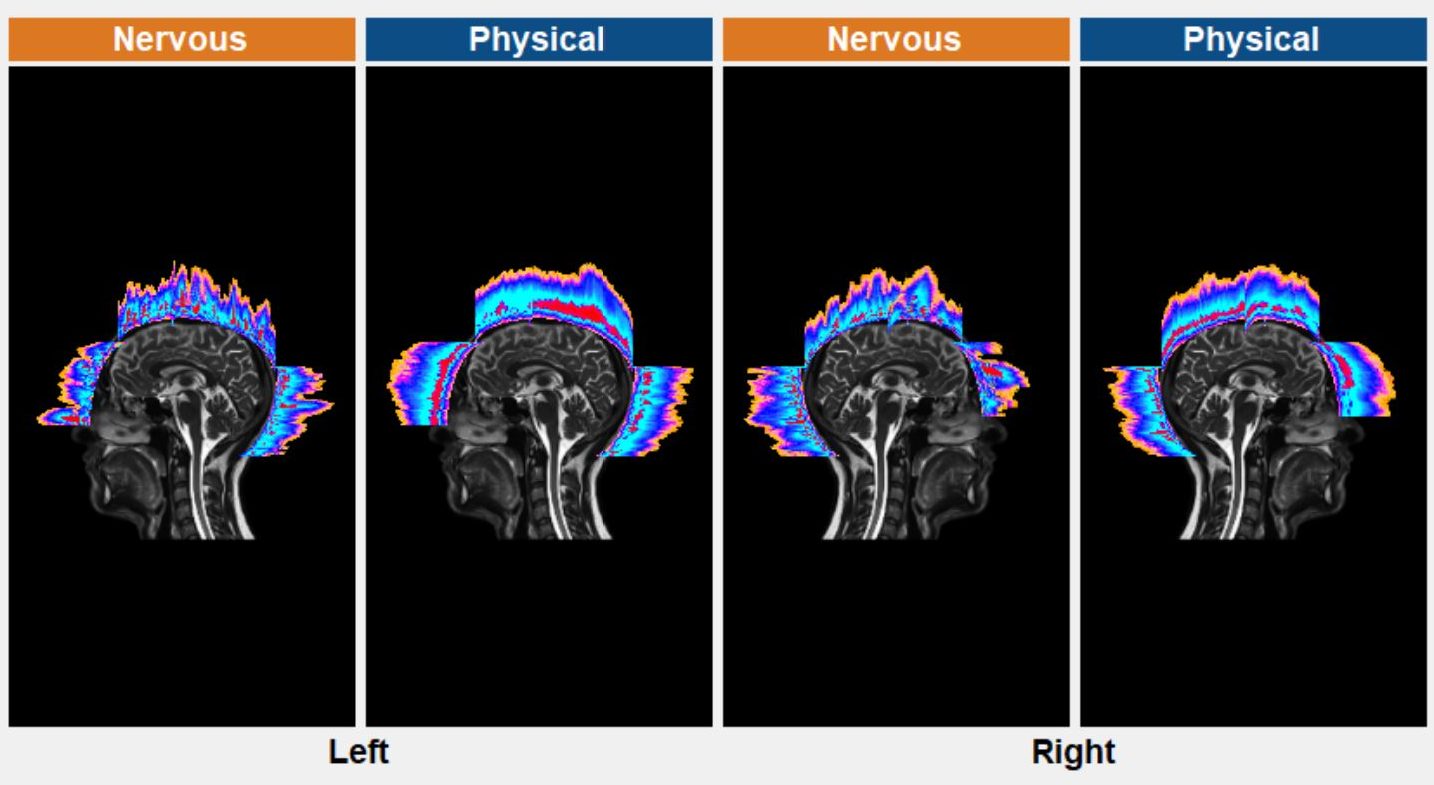
Following the history and trends section you will find the individual systems measures and summaries. The systems that are covered encompass almost the entire body: Circulatory, Respiratory, Digestive, Small Intestine, Large Intestine, Lymphatic and Immune, Renal and Reproductive, Nervous and Endocrine, Musculoskeletal, and Sensory. These sections contain the individual measures for each organ/system. The measures can be from a -100 to 0 to + 100. The optimal range is between -45 to 0 to +45. If a system organ is above the 0-100 range then the multiple is also provided as covered in the organ imbalance section. These numbers represent the relative measure of electrical flow of that portion of the body. If the value is within the optimal range it is representative of good electrical/energetic flow. If the number is in the negative region it indicates a deficiency of electrical flow, whereas the positive region outside of norm indicates an excess of electrical or energy demand by that organ/system.
